Research Question:
How does the acceleration of an object depend on the net force acting on it?
Variables & Controls of the ExperimentVariables
Constant: mass of the system Controls
|
MethodsTo Control the Variables:
First, set up a smooth, flat track for the cart to travel on. Use the same track to ensure that the movement of the cart is not impeded by extraneous objects/ surfaces that may significantly affect its motion, such as different textured surfaces that may increase the friction on the wheels and slow the cart down on the track. Also, use the same cart as the movement of different carts differ. Next, select a set of weights that can be shifted from the cart to the hanger to maintain the total mass of the system and simultaneously altering the net force. In addition, release the cart by letting it go without giving it an initial push so that the initial velocity of the cart is 0 m/s, and its acceleration is majorly dependent on the tension force from the hanger. To Collect the Data:
Mark down exactly how much mass was on the cart and on the hanger to ensure that the total mass of the system stays constant, and also to help future data processing from mass of the hanger to net force. Place a motion detector at the beginning of the track, and align it with the path the cart will take to properly determine its position according to time. After releasing the cart and collecting its position with the motion detector, place the data into Logger Pro and use the data to create a position-time graph. Use the position-time data to create a velocity time graph, then use the slope of the proportional line of best fit of the velocity time graph to get the acceleration, which is our dependent variable. |
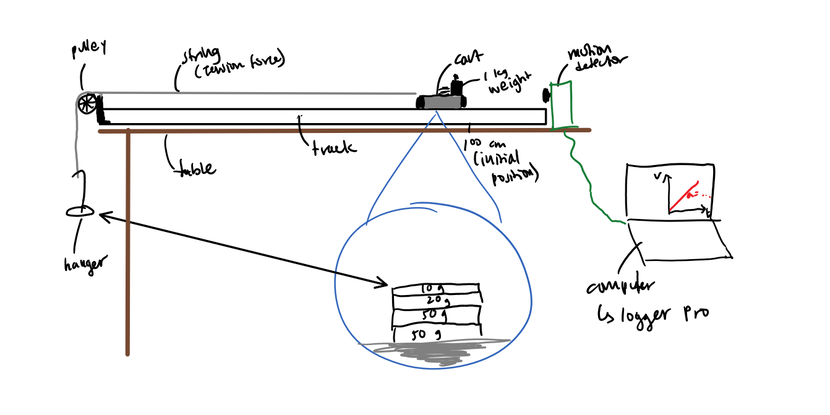
Labeled Diagram of Unbalanced Forces: Acceleration & Net Force Lab Set-Up
Procedure
Before conducting the experiment itself, we measured the mass of the cart (495 g) and the hanger (50 g) by placing them on a scale, and measured the mass of the weights we were using for the experiment (50 g, 50 g, 20 g, 10 g). We kept a 1 kg (1000 g) weight on the cart that was not moved. By adding these masses together, we could get the total mass of the system that should stay constant. Then, we put the cart onto the magnetic area of the ramp so it does not move as we repeatedly moved weights from the cart and placed them onto the hanger, and recorded these changes in the separate weights. We placed the hanger with the added weights onto the string that was attached to the cart and pulley system. Afterward, we released the cart 100 cm from the edge that is closer to the hanger. We used Logger Pro to obtain the acceleration (refer to "Methods", "To Collect the Data"). We did a total of 10 trials with different weights on the hanger.
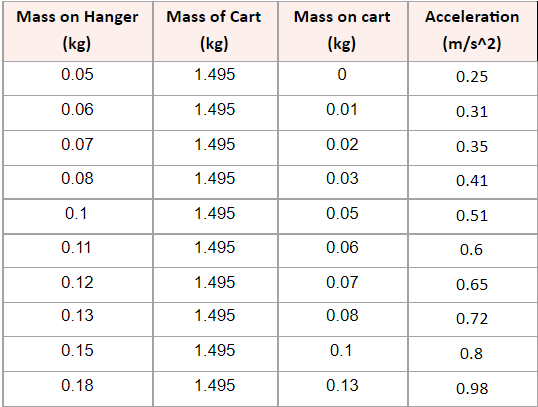
Raw Data - Table
|
Mass of Cart: 0.495 kg + 1 kg weight
Mass of Hanger: 0.05 kg The measurement for acceleration was generated by the Logger Pro application, in which position was measured by the motion detector, converted into a position time graph, was used to create a velocity time graph, and had a line of best fit with the slope as acceleration. |
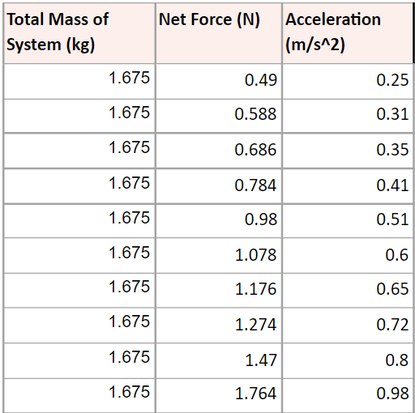
Processed Raw Data - Table
|
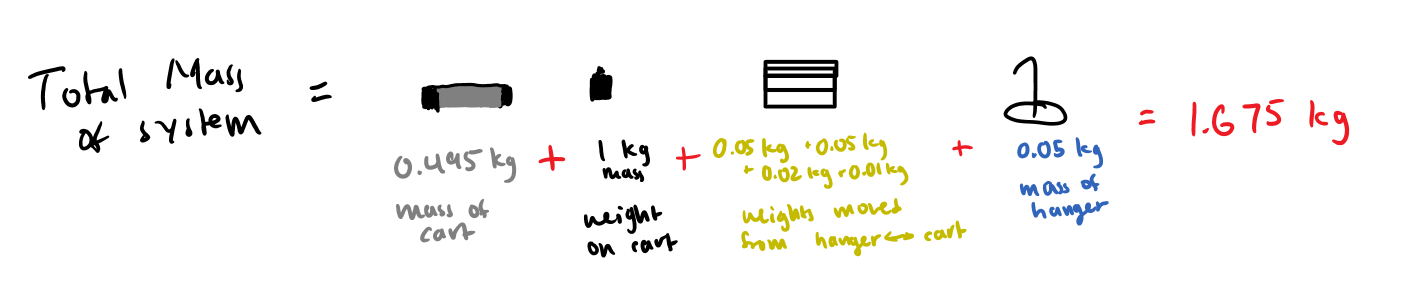
Total Mass of System (kg) = mass of Cart (0.495) + 1 kg weight + mass of hanger (0.05 kg) + mass of moved weights (0.05 kg + 0.05 kg + 0.02 kg + 0.01 kg) = 1.675 kg
Net Force (N) = mass on hanger (kg)* gravitational field strength/ constant (9.8 N/kg) Acceleration (m/s^2) = obtained from Logger Pro (see Raw Data) All of these calculations were made with Google Sheets by typing out the equation used to calculate them and dragging the equation down to automatically be applied to other rows.
|
Processed Raw Data - Graphical Representation
|
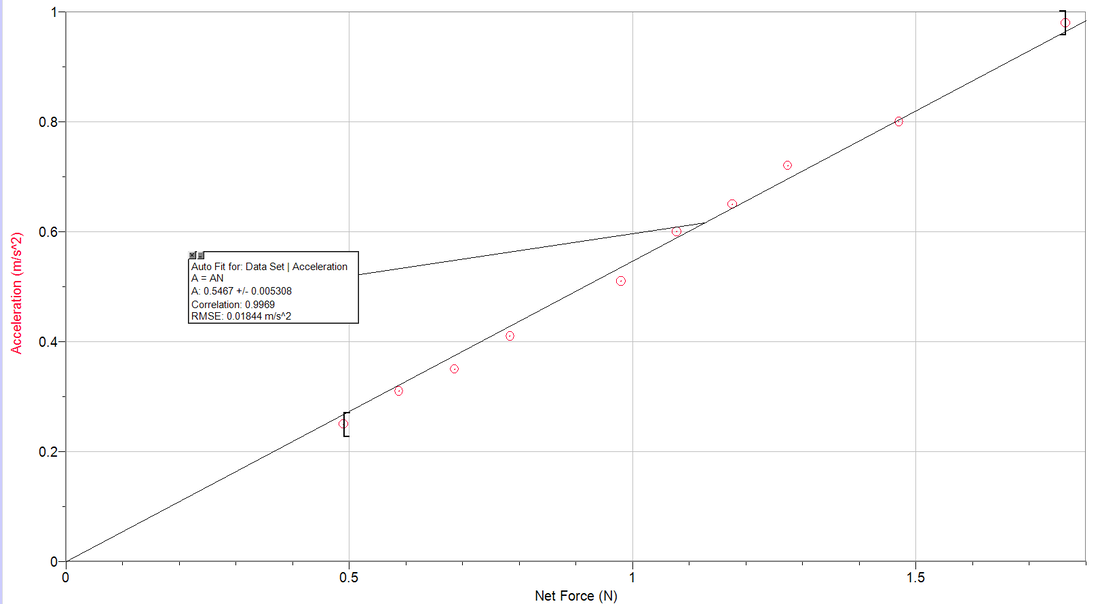
The image pictured on the left is a graph generated by the Logger Pro application. The independent variable (x-value) is Net Force (N) and the dependent variable (y-value) is Acceleration (m/s^2).
The slope of this graph indicates that the acceleration increased by 0.5467 /s^2 as the net force increased. The y-intercept of the graph is 0, which means that the acceleration is 0 m/s^2 when the net force is 0 N. A proportional model (y = mx) was the best fit for this graph as the increase is linear and it passes through the point (0,0). |
