Lab Members: Carol Ge, Katie Diventi, Muskan Manchanda, & Gabby Shapcott
Research Question: How does time affect the position of the moving buggy?
Variables & Controls of the Experiment |
Methods |
|
Variables
Controls
|
To Control the Variables:
Start off by locating a long, smooth, flat surface without obstructions for the buggy to travel on so its movement is generally unimpeded. Hard tile or wooden floor will do. Afterwards, determine a specific amount of time for the buggy to move for each trial, such as five seconds. To keep the initial position of the buggy constant each trial, clearly mark the ground with an object or marker at the chosen initial position. Have the same individual start the buggy on the ground at the initial position each trial by turning on the buggy while it is half a foot off of the ground and placing it down while saying, "start". The second person will start the timer after hearing the person say "start", inputting the specified time and following the buggy as it moves across the ground. Once the timer sounds, they will immediately place an object next to the position of the buggy at that time. The whole experiment should be conducted at the same location with the same materials and individuals for each trial. To Collect the Data: First, input the specified time for the trial into a table. After completing the experiment, the first person will use a meter stick to measure the distance in centimeters from the initial position to the final position, and input the distance into the table. The whole experiment should be repeated until at least 7 trials have been completed. The time for the trials should range from 2 to 15 seconds. |
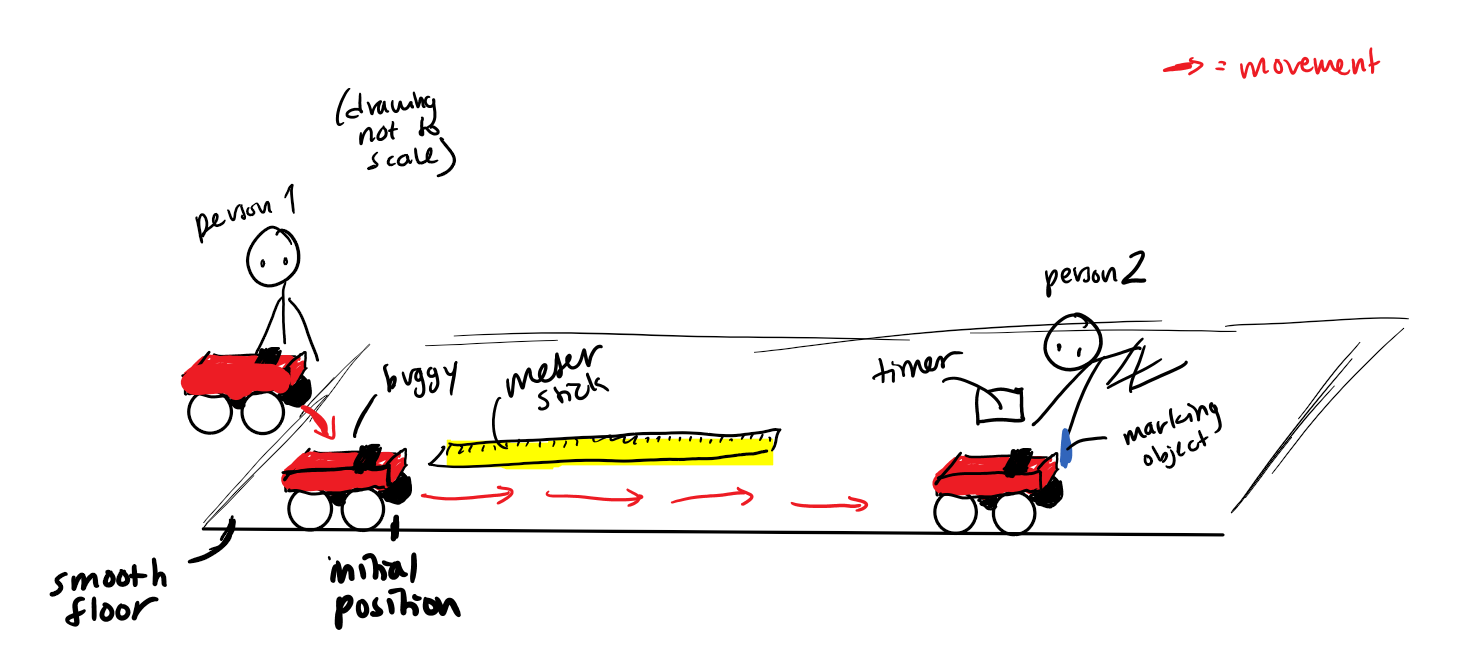
Diagram of the Buggy Experiment Set Up
Procedure
We started the buggy half a foot above the ground, then lined it up with the end of a tile as the initial position. While placing it down, the person yelled, "start" to tell the second person to start the timer. We allowed the buggy to move for a certain amount of time, and marked its final position with a meter stick. We allowed the buggy to keep moving forward following the marking of its position so the person doing the marking wouldn't be slowed down. Then, we measured the distance from the buggy's initial position and its final position after a specified amount of time has passed with a meter stick. This process was repeated 7 times in total, with a range of 2 to 15 seconds.
Raw Data - Table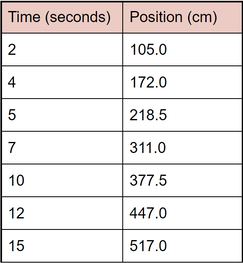
|
Processed Data - Graph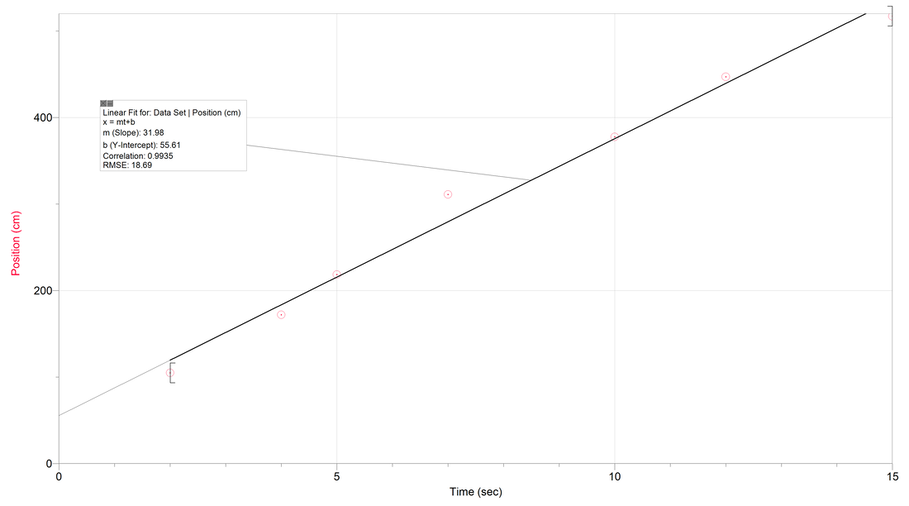
|
The image pictured above is a position-time graph, which was generated by the Logger Pro application. The slope of this graph indicates that the position of the buggy increases by 31.98 centimeters for every one second that has passed. The y-intercept of the graph indicates the position the buggy is at when the time is 0, which is 55.61 centimeters. The linear model was the best fit for this graph as the velocity stayed relatively constant throughout the positions measured.
There was no data processing that needed to be conducted because we did not need to average our measurements of repeated trials.
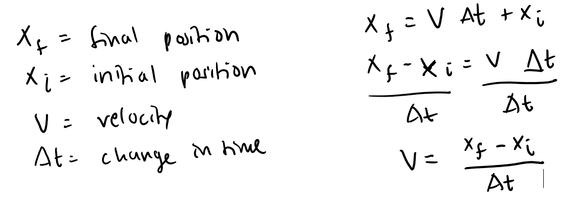
Equations
Conclusion
The position of the buggy increases at a relatively constant rate of approximately 31.98 centimeters for every 1 second, indicating that its velocity is 31.98 centimeters per second.
This lab's purpose was to find the correlation between change in position and change in time, which we identified to be velocity. By carefully measuring the position of the buggy after a specific amount of time has passed for multiple trials, we can generate a graph. We found the change in position and change in time for the overall graph, creating a line of best fit and equation for that line.
The findings in this lab may be used to evaluate the velocity of any moving object traveling in a straight line. For example, one can measure the velocity of an asteroid in the night sky by calculating its precise position in the sky at certain increments of time, comparing the change in position with the change in time to find the velocity.
Evaluating Procedures
Weaknesses and Limitations
Uncertainty
Improvement
To improve this experiment, I would use a distance measuring device to record the change in position rather than having it done by a person because a device can record more accurate data than a human. Humans need to see the stimulus, process it, then formulate a response and carry it out, causing a delay in the measurement due to a reaction time. However, this process is much more streamlined for machines.
Another potential improvement is using a measuring tape instead of a meter stick. Because one meter stick could not cover the entire distance the buggy traveled, we had to shift the measuring stick each time and could have accidentally placed it incorrectly. Thus, a measuring tape that stretches for further distances and does not need to be shifted could eliminate this weakness.
- The buggy did not travel in a straight line, so the measurement of the distance between the final position and the initial position was not entirely accurate because we could not account for the curved path the buggy took. Also, the buggy hit the wall a few times, which may have altered its velocity.
- The identification of the final position was not the most accurate because it had to be done while the buggy was still moving, so it was difficult to assess the exact position.
- There was not sufficient room to make measurements of the buggy's change in position during a time greater than 15 seconds.
Uncertainty
- The starting of the timer and the starting of the buggy movement was not the same as they had to be done by two different individuals.
- We only collected 7 data points, and the point with the longest time is not 10x the value of the shortest time point.
Improvement
To improve this experiment, I would use a distance measuring device to record the change in position rather than having it done by a person because a device can record more accurate data than a human. Humans need to see the stimulus, process it, then formulate a response and carry it out, causing a delay in the measurement due to a reaction time. However, this process is much more streamlined for machines.
Another potential improvement is using a measuring tape instead of a meter stick. Because one meter stick could not cover the entire distance the buggy traveled, we had to shift the measuring stick each time and could have accidentally placed it incorrectly. Thus, a measuring tape that stretches for further distances and does not need to be shifted could eliminate this weakness.
