Unit 4 Overview
|
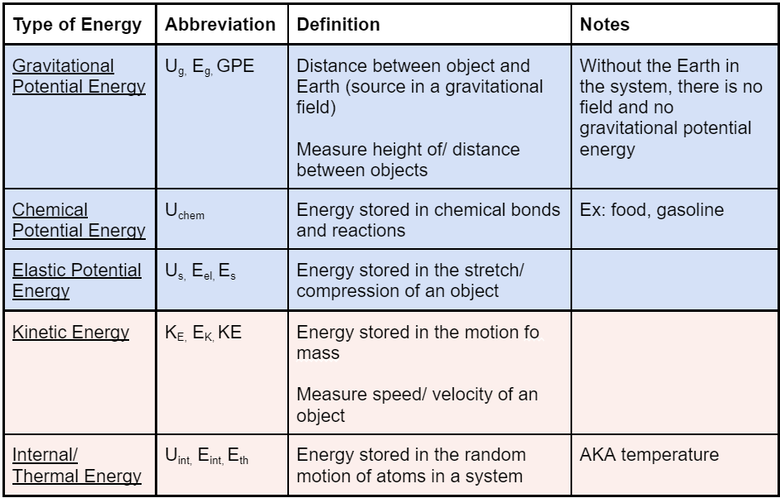
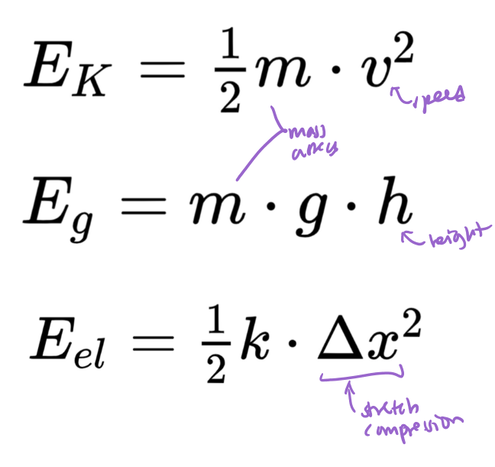
Energy is the ability to do work, and work is a transfer of energy. Mechanical Energy is the sum of all potential and kinetic energy within a system.
The table on the right explains the different types of potential and kinetic energy with more detail. |
|
In this unit, we learned about
We did not conduct any labs with written lab reports in this unit.
- Law of Conservation of Energy
- Representing energy transfers with Bar (LOL) Charts
- Energy Problem Solving
- Work
- Power
- Relating Energy/Work/Power to Forces and Motion
- Connecting Representations of Motion with Representations of Forces with Representations of Energy
We did not conduct any labs with written lab reports in this unit.
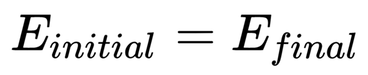
Law of Conservation of Energy
|
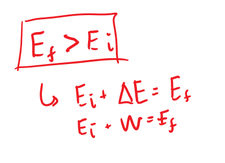
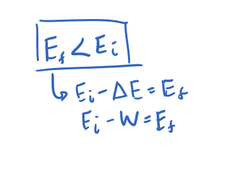
Conservation of Energy Equation
|
Types of Energy Transfers
- Working (W) --> force (external push or pull) on a system
- Ex: a ball falls from a high place
- Heating (Q) --> temperature difference between system and surroundings
- Ex: a hot cup of tea is placed in a cold room, causing the heat to transfer out of the tea and into the air of the room
- Radiating (R) --> matter loses energy by radiating light, and gains energy when it absorbs light
- Ex: O-H bonds getting excited in the food inside a microwave emitting electromagnetic radiation
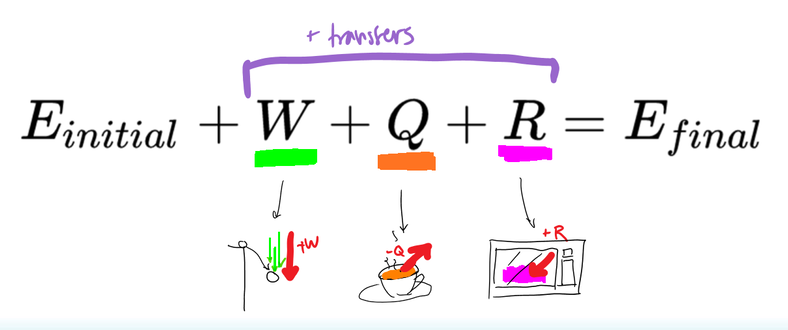
Conservation of Energy Equation
Representing Energy Transfers with Bar (LOL) Charts
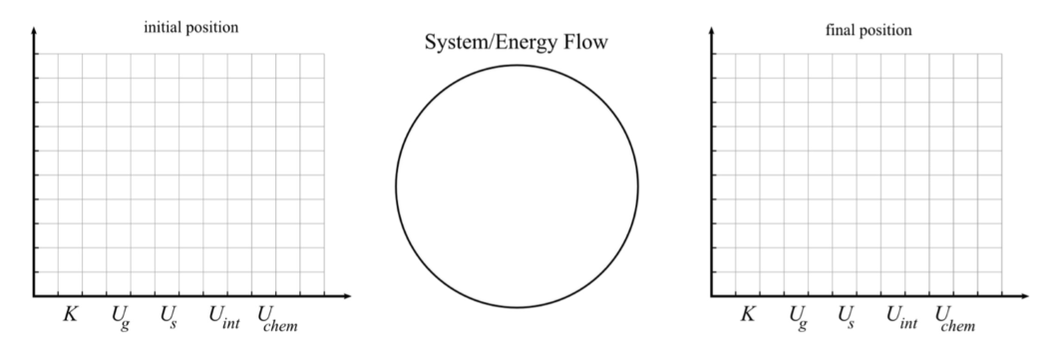
Uses
Be Sure To
- identify different types of energy in a system
- representation of changes in total energy
- model conservation of energy
- see storage, transfer, conserve
Be Sure To
- Keep the total bars consistent -- Conservation of Energy Equation (Ei + W + Q + R = Ef)
Work
Work: transfer of energy
- work is a scalar quantity
- measured in Joules (J)
|
Positive Work
|
Negative Work
|
|
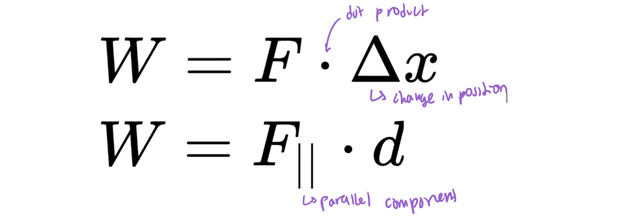
Dot Product: multiply two vectors
Work can only be done when the forces are parallel
THUS, the dot product of two vectors is
|
|
Power
|
Power
Powerful: more energy transferred more quickly 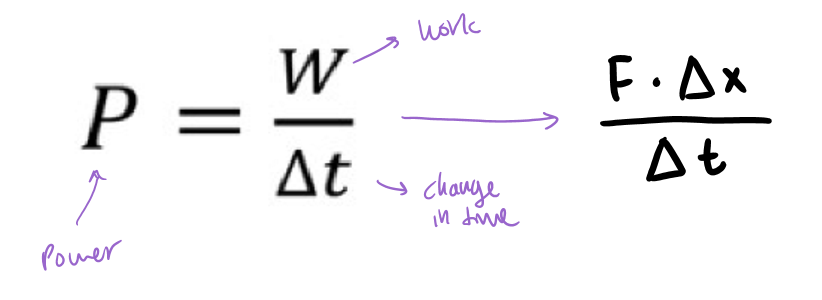
|
For a Human
*** For a Horse & Other Machinery
|
1. Energy Problem Solving
2. Relating Energy/Work/Power to Forces and Motion
|
Steps
|
|
Connecting (1) Representations of Motion with (2) Representations of Forces with (3) Representations of Energy
|
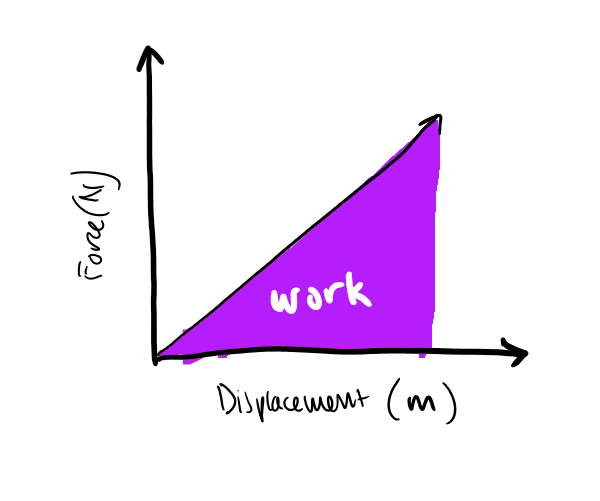
Force vs Displacement Graph
|
Energy vs Time Graph
Example Below: 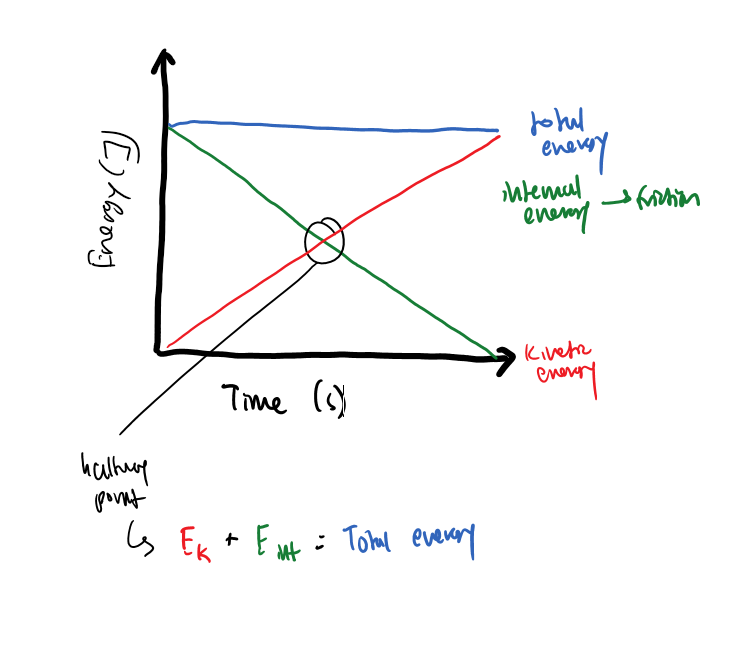
|
Review of (1) Representations of Motions
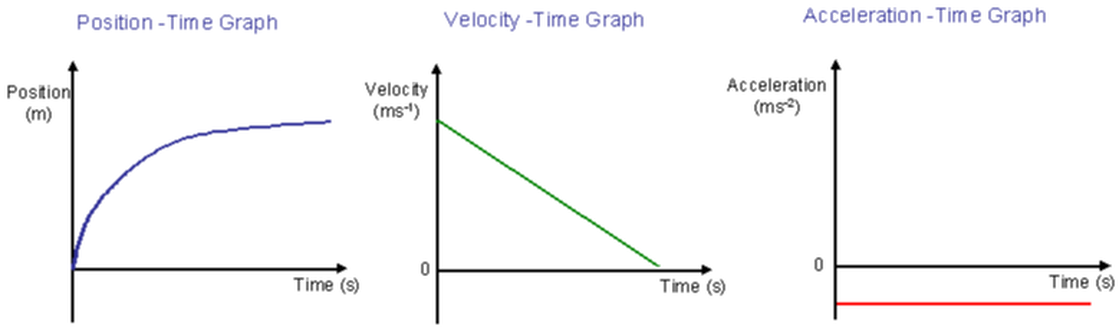
We can use the position time graph to determine the velocity by finding its slope, then use the velocity time graph to determine the acceleration by finding that slope. Conversely, we can find the area between the x-axis and the line for acceleration to create a velocity time graph, then find the area between the x-axis and the velocity graph to create a position time graph. However, without additional information, exact initial position cannot be identified from a velocity time graph or acceleration time graph.
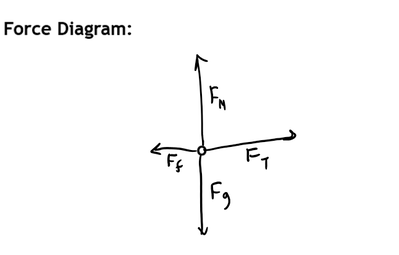
Review of (2) Representations of Forces
|
How to Make a Force Diagram/ Free Body Diagram
|
|
